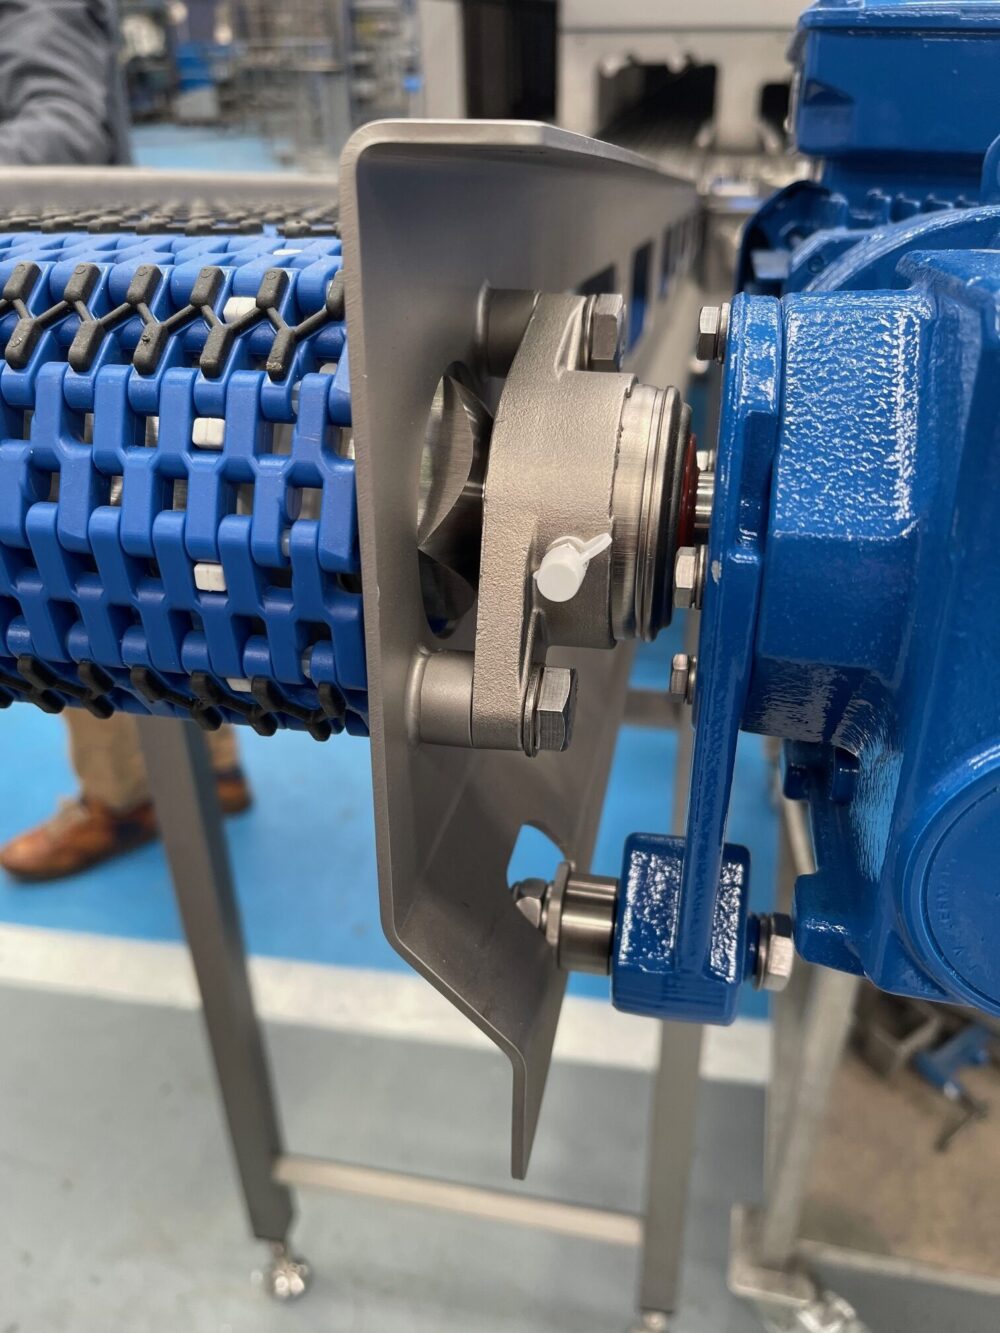
Long-term cost savings from hygienic components are the difference in total life-cycle cost between a cleanable, durable part and a cheaper standard part – and the competitive edge is what documented hygiene is worth to customers. In food, dairy and pharmaceutical processing, the cheaper part often costs more once cleaning, failures and downtime are counted. This guide shows how to build that business case so a technical buyer, an engineer and a finance manager can agree on it.
For the processor-value view from an OEM's perspective, see hygienic design principles drive competitiveness.
What drives the cost of a component over its life?
Purchase price is usually a small part of what a component costs. Over its service life, the main cost drivers are:
| Cost element | Standard component | Hygienic / certified component | What to measure |
|---|---|---|---|
| Purchase and installation | Lower | Higher | Quotes, fitting time |
| Planned cleaning | Longer around threads, gaps, ledges | Shorter: smooth, sealed, self-draining | Minutes per clean at the component |
| Re-cleans and holds | More failed swabs at harbourage points | Fewer | Failed ATP/swab results by location |
| Maintenance and spares | Earlier corrosion, seal and bearing failures | Longer intervals if materials suit the cleaning regime | Failure log, parts used |
| Unplanned downtime | Higher | Lower | Hours lost × value per hour |
| Water, chemicals, energy | Higher per clean | Lower per clean | Litres and detergent per clean |
| Audit and customer approval | More questions, more evidence to create | Certificates and declarations available | Time spent on audits |
Harbourage points are places such as exposed threads, crevices and dead spaces where residue and bacteria survive cleaning.
How to calculate life-cycle cost and break-even
Life-cycle cost (LCC) over a period of N years:
LCC = purchase + installation + N × (cleaning + maintenance + spares + downtime + utilities)
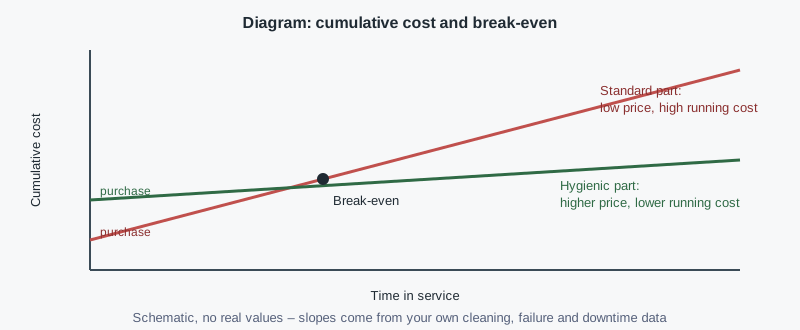
Break-even time for switching to a hygienic part:
Break-even (years) = (extra purchase + extra installation) ÷ annual saving
where annual saving = (standard running cost − hygienic running cost) per year. The cumulative cost lines cross at break-even; after that, every year adds savings.
Example
Assumptions (illustrative, symbolic – insert your own values): a filling line has 12 threaded feet and 6 open bearing housings in the splash zone, cleaned twice daily.
- Extra cost of sealed-thread hygienic feet and sealed stainless bearing units, including fitting: ΔP.
- Cleaning time saved per clean, measured in a trial on one section: t minutes. Cleans per year: n. Labour cost per hour: L.
- Bearing failures avoided per year: f, each costing D in parts, labour and lost production.
- Annual saving S = (t ÷ 60) × n × L + f × D, plus any saving from fewer re-cleans.
- Break-even = ΔP ÷ S. If it is shorter than the planned machine life, the switch pays.
Two practical notes: measure t on a trial section rather than estimating it, and include downtime only when the line would otherwise be producing.
Where the competitive edge comes from
For processors, a competitive edge means lower cost per unit and fewer hygiene incidents. For machine builders, it means winning tenders and approvals. In both cases, what counts is evidence:
- Certificates for specific designs. The European Hygienic Engineering & Design Group (EHEDG) certifies equipment designs as cleanable; certification is widely recognised in Europe and increasingly used worldwide. 3-A Sanitary Standards, Inc. (3-A SSI) promotes food safety through hygienic design, mainly in North America; conforming designs may carry the 3-A Symbol after a Third Party Verification. Both are voluntary.
- Declarations of compliance for food-contact materials (EC 1935/2004; EU 10/2011 for plastics; FDA 21 CFR 177.2600 for rubber).
- Cleaning instructions and verification data showing the machine can be cleaned in the stated time.
- Operating cost data – cleaning time, water and detergent per clean – that customers can compare.
A reputation for quality builds on this evidence, not on claims.
Common mistakes in the business case
- Comparing unit prices only – the cheapest part often has the highest running cost.
- Counting savings that are not real – downtime saved only matters if the line would otherwise produce.
- Assuming certification guarantees durability – EHEDG and 3-A cover cleanability; check materials, seals and load ratings separately.
- Not measuring afterwards – without before-and-after data, the next business case is harder to approve.
Which components give the fastest payback?
Start where cleaning time and failures concentrate:
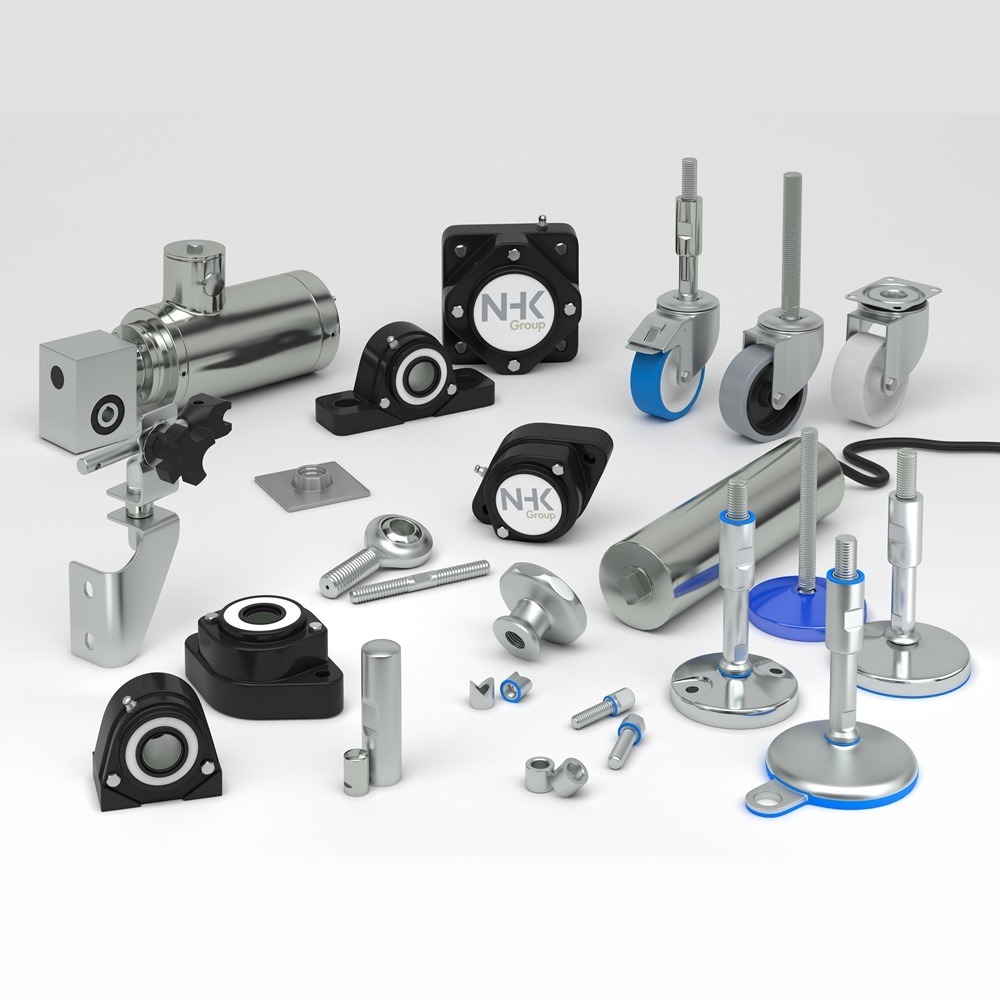
- Levelling feet in wet zones – exposed threads are slow to clean and corrode. Hygienic adjustable leveling feet with sealed threads provide stability and support and remove the thread from the cleaning task. See NHK's SHAF adjustable feet in sealed hygienic design, an EHEDG-certified design.
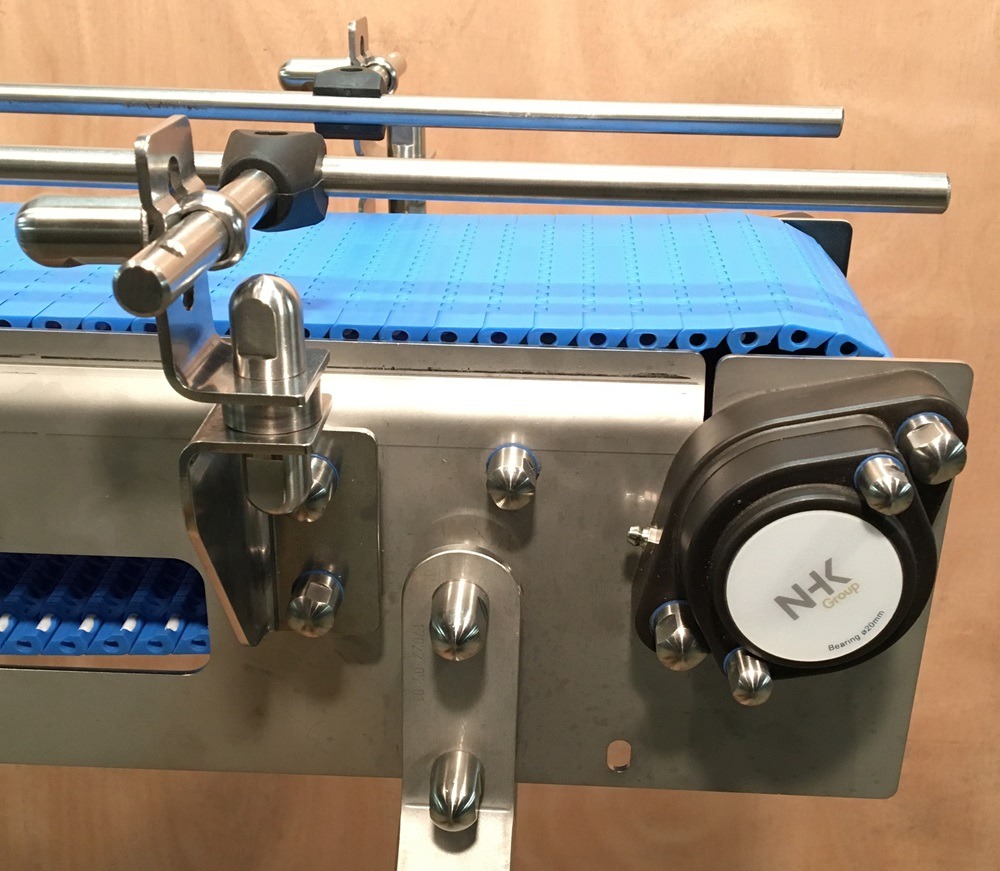
- Bearing units exposed to washdown – water ingress causes failures and downtime. Sealed units help; IP67 (IEC 60529) confirms immersion protection, not resistance to high-pressure washdown (IP69K, ISO 20653).
- Fasteners near the product – hex sockets and exposed threads need spot cleaning and can loosen.
- Enclosure parts – sanitary designs with sloped tops and flush gaskets shorten cleaning around electrics.
Components in the non-contact zone (away from product and spray) usually pay back slowest; prioritise the product-contact and splash zones.
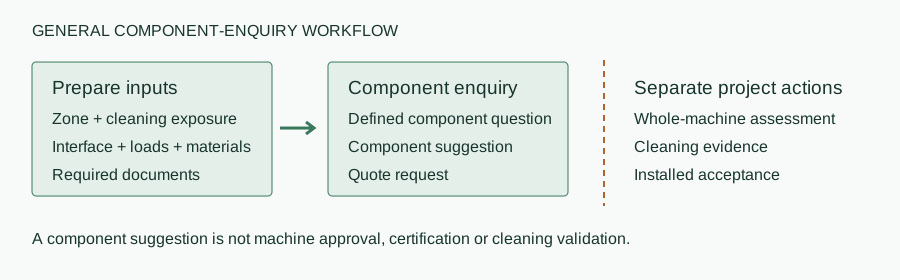
What to put in the RFQ
- Zone and cleaning method (foam, high-pressure, CIP/COP), chemicals and temperatures.
- Material grade – AISI 304, or 316L where chlorides are present – and elastomer (EPDM, FKM, VMQ) matched to product and chemicals.
- Hygienic features: no exposed threads, crevice-free, self-draining, sealed to the frame.
- Documents: declaration of compliance, material certificates, EHEDG certificate or 3-A authorisation naming the model where claimed.
- Ratings: load, temperature, IP rating, stated on the datasheet.
- Expected service life and recommended inspection and replacement intervals.
For the full total-cost-of-ownership method across a whole machine, see manufacturing success: how and why. NHK's article: long-term cost savings and competitive edge.